
Smart Money zones,
read in the footprint.
A candle shows that price tested a zone. The footprint shows what the test was made of. We open the bars inside real order blocks — bid × ask, delta and imbalance from exchange trade data — and the Order Flow Lab lets you practise footprint reading yourself, on its own set of real market scenarios.
A candle gives you four numbers.
A footprint opens the bar.
On a candle chart, an order block is a box and every test of it looks alike. On a footprint, each test has a composition: who was aggressive, at which prices, and how much it moved price.
Where price went during the bar. Nothing about what was traded inside it, or by whom.
Aggressive selling and aggressive buying at each price inside the bar, with imbalances highlighted. (Illustration.)
Which side was aggressive
Delta shows whether market buying or market selling dominated a bar — and the rows show at which prices it happened.
Where the volume sat
The heaviest rows show where trading concentrated — inside a zone, at its boundary, or beyond it — not just the range a wick touched.
Effort versus result
Heavy aggression that fails to move price, or aggression that fades bar by bar, is visible in the cells and invisible in a candle.
A footprint records what happened inside bars that have already closed. It does not forecast the next one — which is exactly what makes it worth studying. How to read a footprint →
Read it. Practise it. See it on your own charts.
Every study starts from a zone our free detector drew, opens the bars inside it, and names what they were made of. The Lab drills the skills underneath, on its own scenario set, until reading a footprint is yours.
Footprint Reads
Written · Free
Order blocks and supply and demand zones opened bar by bar — bid × ask, delta and imbalance inside every test, computed from real exchange trade data.
Order Flow Lab
orderflow.smcchartsense.com
Graded drills on the skills behind every read: delta, CVD, imbalance, absorption, exhaustion and sequence reads, on real BTC market data, with every answer derived from stated, checkable rules.
Your own charts
TradingView · Free tools
Our free Order Block Detector draws the zones these studies read, on any TradingView account. Open a footprint view on any chart you choose to study.
TradingView links on this page are referral links — if you later purchase a TradingView plan after using them, we may earn a commission at no extra cost to you.
Inside the bars of real zones
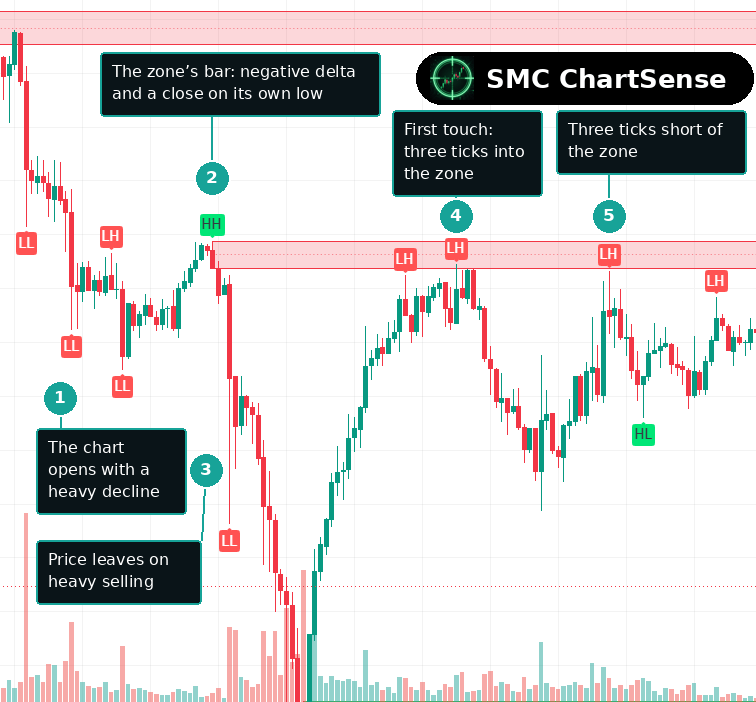
Each study takes one order block from a historical chart, reads it in candles, then opens its decisive bars in a footprint computed from the exchange’s own trade data. Instrument, dates and prices are withheld so the reading stays on behaviour.
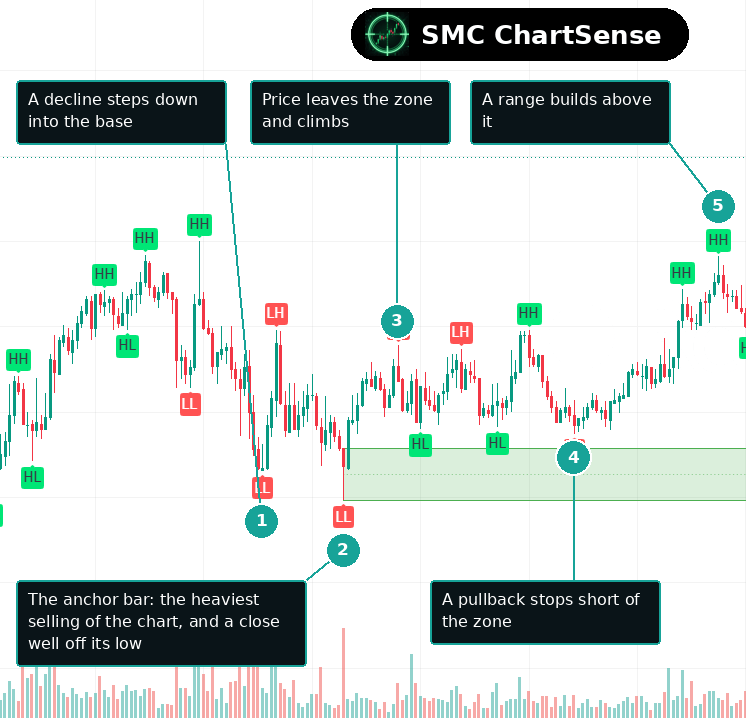
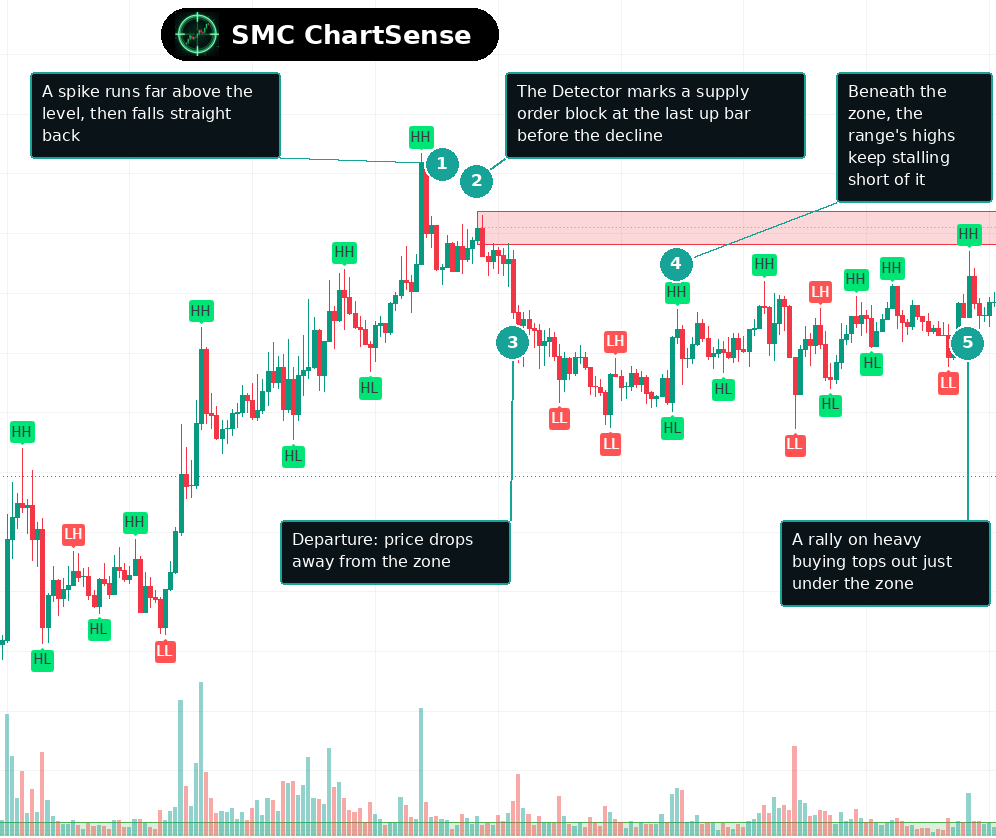
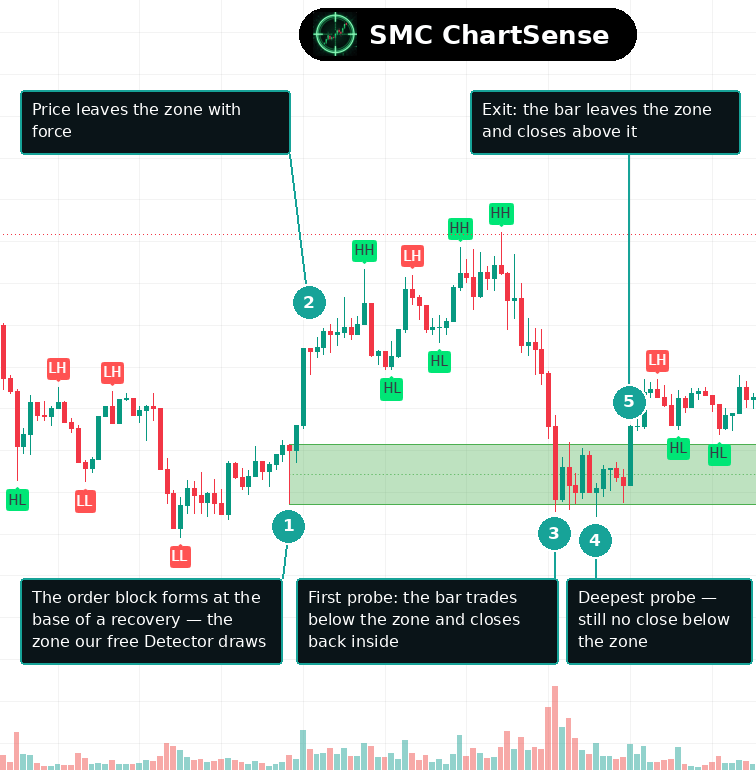
Reading a study is the start.
Reading one yourself is the skill.
The Lab is where the skill gets practised: real footprint bars from its own scenario set, one question at a time, scored against rules you can check. No video course, no live data — scenarios cut from real market history.
124 graded scenarios
Which side was aggressive, where the imbalances stack, whether a bar absorbed or exhausted — answered on real BTC footprint bars and scored instantly.
Rules you can check
Every answer comes from a stated rule — the diagonal imbalance ratio, the delta sign, the close position — so you learn the reasoning, not a guess.
From anatomy to sequences
Eight modules, from volume and CVD through footprint anatomy, absorption and volume profile to SMC levels on the footprint and multi-bar sequence reads.
Educational drills on historical market data — not investment advice.
Our TradingView Indicators
The same framework as our guides and chart reads — order blocks, liquidity sweeps, and passive-flow absorption — drawn automatically on your charts. Three free tools, and one invite-only.
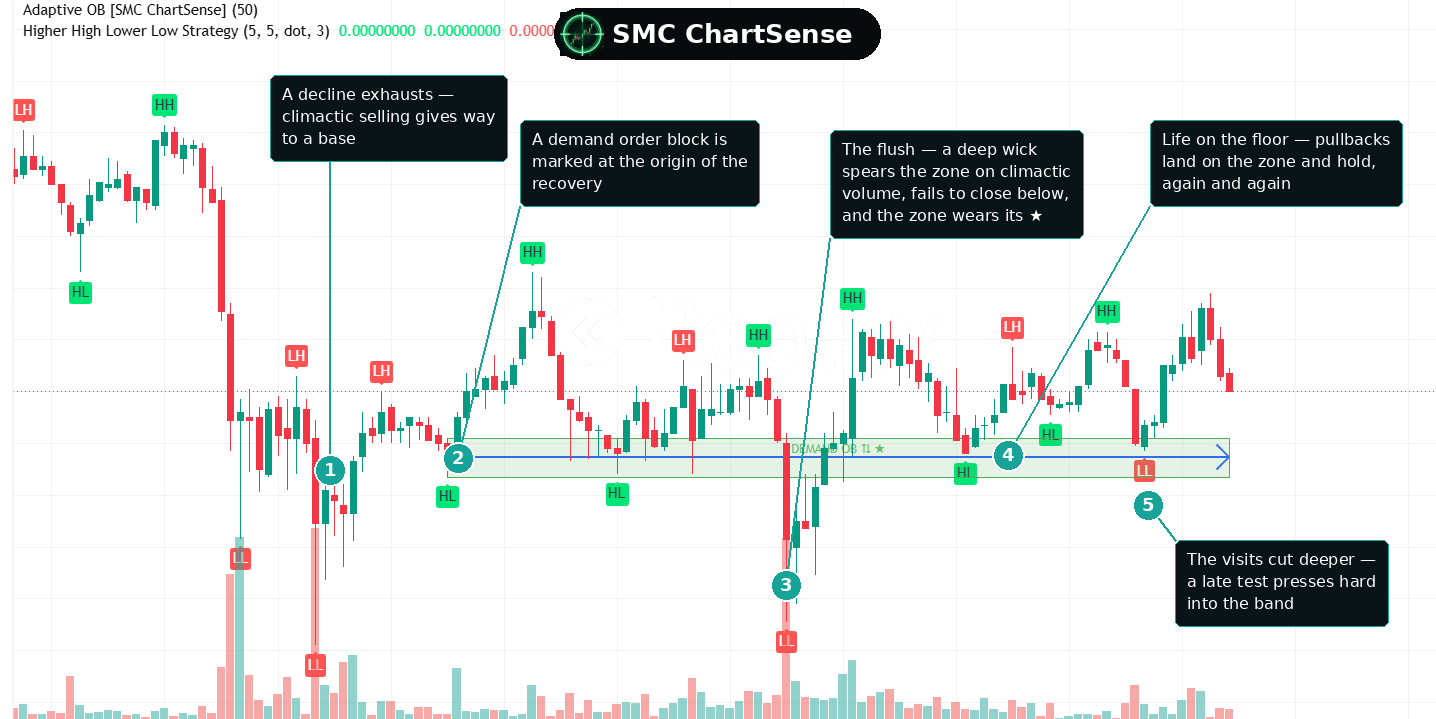
Our first premium tool: a full zone lifecycle. A close-through is a hypothesis, not a verdict — breakers appear only when price confirms the conversion, failed breakdowns bring the zone back marked ★, and every historical zone stays on the chart for study. 7-day free trial · founding pricing for the first 25 members.
OB detection with a mandatory FVG gate — no displacement gap, no zone.
Add free on TradingView →Marks the bar where a failed move reversed — only when five independent filters agree.
Add free on TradingView →Grades zones by the passive flow that defended them — volume delta + open interest.
Add free on TradingView →30+ structure reads on real charts
The archive the footprint reads grew from: order blocks, breakers, liquidity sweeps and fair value gaps, read phase by phase on historical charts.

SMC Practice App
Build your eye for structure on your phone: 600+ chart scenarios across 6 practice modes — order blocks, FVGs, BOS, candlestick and chart patterns — with explanations in Pro Mode. 5K+ downloads, free with occasional ads.
Latest lessons
Learn to read the market from basic candlestick reading to advanced Smart Money Concepts.
Start with one read.
Pick a footprint study, follow the zone bar by bar, then practise footprint reading yourself in the Lab’s free lessons.
Charts on this site are drawn on TradingView (referral link — we may earn a commission if you later purchase a plan, at no extra cost to you).
DISCLAIMER: SMC ChartSense provides educational and research tools — footprint and chart reads of historical markets, the Order Flow Lab drill course, free TradingView indicators, a free pattern-recognition app (Play Store) and a strategy backtesting platform (app.smcchartsense.com). We do not provide investment advice, trading signals, brokerage services, or execution platforms. Footprint figures and backtest results are computed from historical data — past behaviour does not guarantee future results. We are not registered as a SEBI Research Analyst.
Read Full Terms & Legal Disclaimer
© 2026 SMC ChartSense.