
Order Block Retirement: Zones Die Two Ways — Broken, or Spent
A supply zone authored a deep markdown, defended two retests — and then its life was ended with price still beneath it: retired as spent, its work complete. The advance that later crossed the former area met no fight, because the chart had already, and correctly, forgotten it. The half of invalidation logic nobody writes about.
SMC ChartSense Team · 16 min read
What this article reads: One supply order block across two annotated views, in ten phases: birth at a failed advance, the deep markdown that was its largest reaction, two defended retests — and then retirement: the validity span ending with price still below the band, the zone honestly removed as spent, and the later advance crossing the former area over cleared ground. The focus is chart memory: zones die broken, or die spent — and forgetting on time is as important as detecting on time. Zone markings and validity arrows shown are descriptive detections of historical structure, not recommendations or trade prompts.
Our previous read showed a supply zone that refused to die — surviving multiple genuine closes above its top line, each one reclaimed rather than accepted, before finally resolving in the sellers’ favour. That read answered one half of the invalidation question: when should a zone stay on the chart? This read answers the other half, and it is the half almost nobody writes about: when should a zone leave?
Because zones die two ways. They die broken — the market accepting beyond them, the case the whole wick-versus-close arc has studied. And they die spent — the zone doing its job so completely that the supply which defined it has been consumed in the winning. A spent zone is not defeated; it is finished. And a finished zone left on the chart is worse than clutter — it is a false reference, a ghost ceiling that a later advance will appear to ‘break’ when in truth there was nothing left there to break.
On this LTC chart, a supply zone forms at a swing high, delivers a deep markdown, caps the recovery twice more — and then, after its final sharp rejection, its validity span simply ends. The zone is retired as spent, with price still trading beneath it. What follows is the point of the read: the eventual advance drives straight through the former area, over ground the chart had already cleared, and the read of that advance is clean precisely because no ghost was left behind to misread. Chart memory — knowing what to forget, and when — is the ten-phase subject below.
Phases 1–5 — The zone’s working life

1. An advance tops — the origin
The chart opens with an advance running out at a swing high — the point where the buying that drove the left side of the chart was finally sold. This failure point is the origin: the footprint of the sellers who capped the move, and the anchor from which the supply zone is drawn.
As with every zone in this library, the origin is a record of a real battle. What this read tracks is not whether the battle happened — it did — but how long its record stays relevant, and what the honest end of that relevance looks like.
2. The supply zone is born — and its span begins
The zone is marked at the failure point, and its validity span begins — the arrow through the band that advances while the zone lives and freezes where its life ends. From this bar, the chart is tracking not just a level but a lifetime.
The span is the read’s central instrument. A zone’s worth is its persistence, and persistence has two honest endings — the market accepting beyond the level, or the level completing its work. This zone’s span will end the second way, and the arrow is what makes that ending visible rather than silent.
3. The deep markdown — the zone’s first and largest reaction
From the zone, price falls hard — a deep, sustained markdown that carries far below the band, the largest single move on the chart to this point. The supply that formed the zone did not merely cap the advance; it reversed it emphatically.
A reaction of this size is the zone working — and working, for a supply zone, means its resting orders are being filled into the decline they caused. Every reaction a zone produces is drawn from the same finite account. The deep markdown is a triumph on the chart and a withdrawal from the account at the same time — the lifecycle read’s lesson, playing out at full scale.
4. The recovery returns — the band caps it again
Price bases far below and recovers, and the recovery eventually climbs all the way back to the band — which caps it. The zone’s second test, passed: the advance stalls at the level and turns away, the supply still present, still defending.
The zone is now a proven level by every standard the earlier reads established — formed at a genuine battle, author of a major reaction, and defended on its first retest. It is also, by the same token, further spent. Both ledgers advance together, and only one of them is visible in price.
5. The final tag — rejected sharply once more
The recovery regroups and presses the band one more time — and is rejected sharply again, price turning down hard from the zone’s edge. Another test, another defense, another emphatic reaction away from the level.
It is the zone’s last act. Everything the level was built from has now been expressed: the originating battle, the deep markdown, and two defended retests, each paid for from the same resting supply. What happens next is not another test — it is the engine’s accounting of everything that came before.
Phases 6–10 — Retirement, and the advance over cleared ground
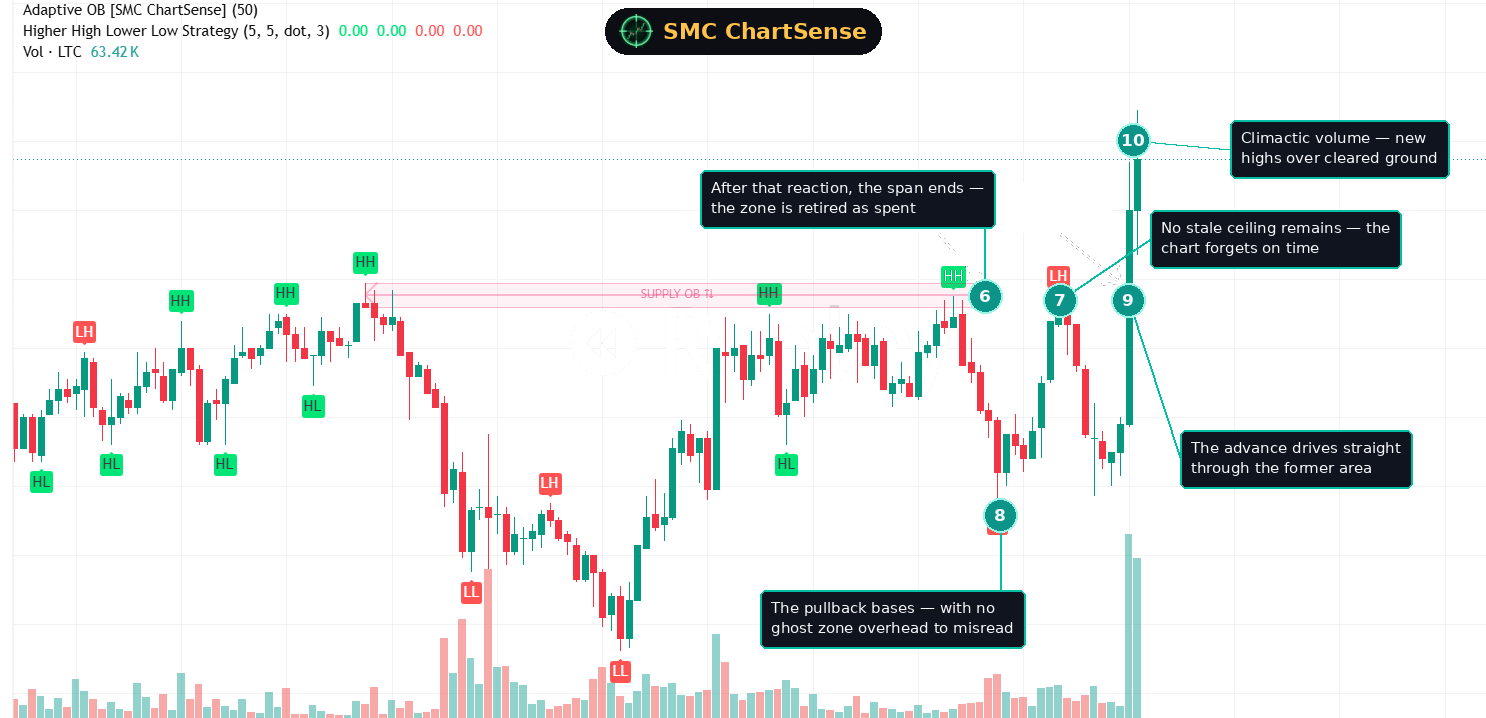
6. After that reaction, the span ends — retired as spent
Following the final rejection, the validity span stops advancing. The arrow freezes; the zone’s life is closed — not because price broke it, but because the zone had delivered its reactions in full. Retired as spent: the record of the level preserved, its active status honestly ended, with price still trading below the band.
This is the retirement half of invalidation logic, and it is the half a simple close-through rule cannot express at all. Under that rule a zone lives until broken — which means a zone that keeps winning lives forever, growing staler with every victory. An engine that can also retire a zone for completing its work is keeping the chart’s memory honest in both directions: zones stay while the market hasn’t decided, and leave when their part of the deciding is done.
7. No stale ceiling remains — the chart forgets on time
Look at the chart immediately after the retirement: the area where the zone lived is now just price history. No active band, no standing ceiling, no reference demanding to be respected. The chart has forgotten the level at the moment forgetting became the accurate thing to do.
Forgetting on time is as much an accuracy question as detecting on time. A level’s meaning is its resting orders; when those have been consumed across a life of reactions, the honest representation of that price region is nothing. Every stale zone a chart carries is a claim about supply that no longer exists — and claims like that compound into systematically wrong reads.
8. The pullback bases — with no ghost overhead to misread
Price pulls back and builds a base below the former area — and the read of that base is clean. There is no ghost zone overhead to frame the structure as ‘trapped beneath supply,’ because the chart is no longer asserting that supply exists there. The base is just a base, read on its own terms.
This is where retirement quietly pays. Had the spent zone remained active, everything about this structure would have read differently — the base as compression under a ceiling, the coming advance as a challenge to standing supply. Every one of those framings would have been built on a level that had already given everything it had. The absence of the zone is not missing information; it is the information.
9. The advance drives straight through the former area
The move that follows resolves the point: a powerful advance drives up and straight through the region the zone once occupied — no stall, no fight, no reaction at the former band. Price passes through the old level as if it were not there, because, in every sense that matters, it no longer was.
Under a stale-zone chart this candle would look like a dramatic ‘break of supply.’ In truth nothing was broken — the supply had been spent across the zone’s lifetime, and the advance simply travelled through cleared ground. The difference between those two readings is the difference between a chart that remembers honestly and one that doesn’t.
10. Climactic volume, new highs — over cleared ground
The advance extends on the heaviest volume of the chart’s right side, carrying to new highs well above everything the old zone once capped. The region that spent the chart’s middle acting as a ceiling is left far below — crossed, this time, without ceremony.
The pair of reads closes here. The previous chart showed the engine holding a zone through every fake close because the market had not yet decided — persistence when persistence was honest. This chart shows the same engine ending a zone’s life with price still beneath it, because the level’s work was complete — retirement when retirement was honest. One engine, two opposite endings, each matched to what the market had actually done. That symmetry, not either ending alone, is the argument.
What this scenario teaches that most SMC content misses
Zones die two ways — broken, or spent — and most charts only model the first. A broken zone fails its test; a spent zone passes every test until there is nothing left to test with. The reclaim read showed the first kind of ending done carefully; this read shows the second kind existing at all. A zone that authored a deep markdown and defended two retests has expressed its supply — and a detection approach with no concept of ‘finished’ will carry that zone as live resistance long after the resistance has ceased to exist.
Stale zones are not neutral clutter — they are wrong claims. An active zone is an assertion: resting orders live here. When a level’s supply has been consumed across its lifetime of reactions, keeping the zone active keeps asserting something false, and every later read inherits the error — bases misread as trapped, advances misread as breaks, ‘failures’ at levels where nothing remained to fail. The advance on this chart crossing the former band without a flicker is what a spent level actually behaves like — and what a chart that retired it on time correctly showed.
Honest memory means endings in both directions. The previous read’s zone was kept alive through multiple closes beyond it — because the market kept declining to accept. This read’s zone was ended with price still beneath it — because its work was complete. Neither behaviour is bias; together they are the same principle applied symmetrically: the chart’s memory should track what the market has actually resolved, keeping levels exactly as long as they mean something and not one bar longer.
The reader’s takeaway
This chart is the quiet half of invalidation logic. A supply zone formed at a genuine failure point, authored the chart’s deepest markdown, capped the recovery twice — and then, after its final sharp rejection, its validity span ended with price still below the band: retired as spent, its supply expressed in full across its lifetime. The advance that later crossed the former area did so without a fight, over ground the chart had already, and correctly, cleared.
The concept to carry is the second ending. The wick-versus-close arc — sweeps, reclaims, decisive closes — governs how zones die in defeat. This read adds how they die in completion: a level whose reactions have consumed its own foundation is finished regardless of never being broken, and the honest chart marks that finish. ‘Broken or spent’ is the full taxonomy; most tools, and most readers, only carry half of it.
Read beside its companion, the pair makes the argument neither could alone. One zone held through every premature verdict because the market had not decided; one zone was ended before any breaking because its part in the deciding was done. Persistence and retirement, each applied where the chart’s actual behaviour earned it — that symmetry is what honest zone memory looks like, and it is the standard every read in this library holds its levels to: on the chart exactly as long as they mean something, and not one bar longer.
Would a setup like this have held up across years of data?
Reading one chart is insight. Knowing whether a pattern has a statistical edge across hundreds of historical instances is something else. SMC ChartSense lets you configure SMC strategy parameters — order blocks, FVG, market structure, risk-reward — and backtest them against years of Binance perpetuals data. No coding required.
Try the SMC Backtester →Educational research tool. Not investment advice. Past performance does not guarantee future results.
DISCLAIMER: This article is for educational purposes only. It explains concepts from technical analysis literature and reads a historical chart for teaching purposes. It does not constitute financial advice, trading advice, or investment recommendations. SMC ChartSense is strictly an educational simulator designed for pattern recognition practice. We do not provide brokerage services, market recommendations, or execution platforms. We are not registered as a Research Analyst. Charts shown are historical examples selected for educational illustration only. References to any instrument, exchange, or price level describe past market behaviour and are not statements, opinions, or forecasts about that instrument’s current or future price.