
Stacked Supply: How Layered Order Blocks Cap a Bearish Trend
A clean tape read of a sustained downtrend, where multiple order blocks at the same price band form a reinforced ceiling that caps every recovery attempt. Twice the market mounts a rally back toward the stacked supply, and twice it arrives on weak volume, gets rejected, and resumes the markdown to fresh lows. The teaching most SMC content skips: stacked OBs aren’t a series of separate levels — they’re one reinforced ceiling, and the quality of the rally into them is the entire trade.
SMC ChartSense Team · 15 min read
What this article reads: A complete bearish trend-continuation cycle against stacked supply. The chart opens in a clean LL/LH downtrend, and a band of layered order blocks forms near the early highs — multiple OB zones at a similar price, reinforcing one another into a single ceiling. Twice during the descent, price recovers toward that stacked supply, and both times the rally arrives on unconvincing volume, gets rejected at the band, and the downtrend resumes to fresh lows. The markdown finally exhausts at a far-right capitulation low that prints on a volume spike, followed by the first higher high off the low. The teaching focus is how to treat stacked OBs as one reinforced level rather than separate lines, why a weak-volume rally into supply is a continuation signal rather than a reversal, and how the volume on the approach — read against the stacked zone — tells you whether to stay short or stand aside.
Phases 1–5 — The downtrend, the stacked supply, and the first rejection
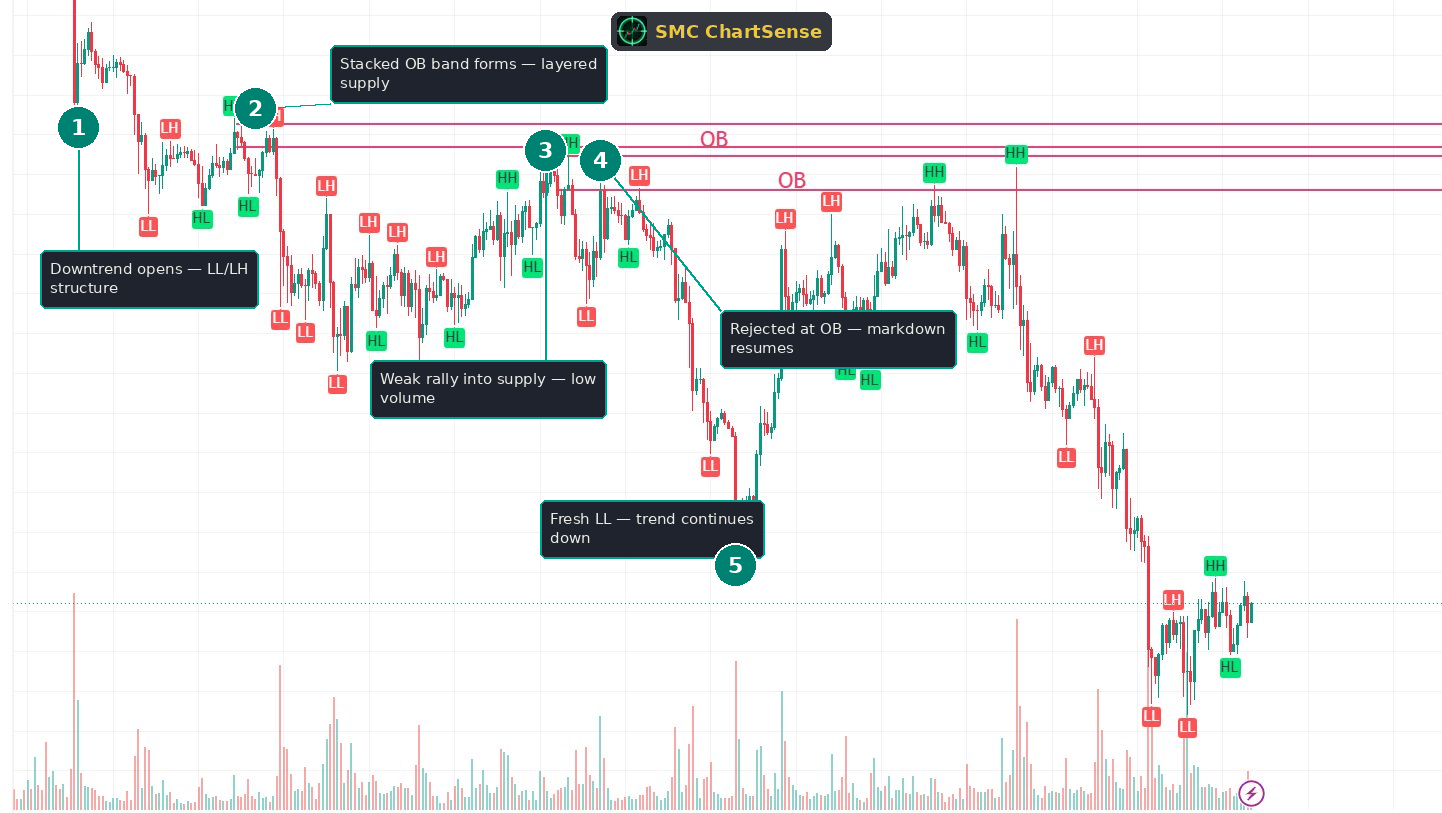
1. Downtrend opens — LL/LH structure
The chart opens already in a downtrend. Price prints lower lows and lower highs from the start, the textbook structure of a bearish market. (LL = Lower Low, LH = Lower High; the alternating sequence that defines a downtrend, the mirror of the HH/HL sequence that defines an uptrend.)
The first thing to establish on any chart is the directional bias, and here it’s unambiguous: down. Every read that follows must be made against this bias. In a downtrend, rallies are retracements to be sold, not reversals to be bought — until the structure proves otherwise by breaking the sequence of lower highs. This bias is the anchor for the entire chart, exactly as a bullish BOS would anchor an uptrend. The difference here is that the bias is bearish, which inverts every instinct most retail traders bring to a chart: they want to buy dips and catch bottoms, and a clean downtrend punishes both.
2. Stacked OB band forms — layered supply
Near the early highs, a band of order blocks forms — and crucially, there isn’t just one. Multiple OB zones print at a similar price, marked by the stacked horizontal lines in the upper portion of the chart. (Order block = the last opposing-side candle cluster before a strong move in the new direction; here, the supply that prints before each leg down.)
This is the central concept of this chart. When multiple order blocks form at a similar price band, they don’t compete or cancel — they reinforce. A single OB is a level; a stack of OBs at the same band is a reinforced ceiling. Each layer represents a separate occasion on which sellers delivered supply at this price. The more layers, the more institutional supply is concentrated in the band, and the stronger the rejection is likely to be when price returns.
Most retail SMC education treats each OB as a separate, independent level to be analyzed in isolation. That fragments the picture. The more useful read is to recognize when several OBs cluster into a single zone and to treat that cluster as one high-conviction ceiling. The stacked band on this chart is exactly that — a reinforced supply region that will cap every recovery attempt for the rest of the chart.
3. Weak rally into supply — low volume
After the initial markdown, price mounts its first recovery and grinds back up toward the stacked OB band. This is the first test of the reinforced ceiling, and the volume panel is what tells you how to read it.
The rally into the supply arrives on weak, unconvincing volume. The candles climbing toward the band are smaller-bodied, and the volume bars beneath them are unremarkable — no expansion, no surge of buying conviction. This is the signature of a retracement, not a reversal. A genuine reversal that’s about to break through supply arrives with volume expansion — buyers committing in size to overwhelm the sellers. A retracement that’s going to fail arrives quietly, on the kind of low volume that says the buying is just short-covering and dip-buyers, not institutional accumulation.
This is the diagnostic that defines the trade. In a downtrend, a rally into stacked supply on weak volume is the market offering a short. The weak volume tells you the buyers don’t have the conviction to break the ceiling, and the stacked OB band tells you the sellers have concentrated supply waiting. The combination — weak demand meeting reinforced supply — is a high-probability rejection setup.
4. Rejected at OB — markdown resumes
The rally reaches the stacked OB band and rejects. Price stalls at the layered supply, prints an LH, and rolls back over into the downtrend. The reinforced ceiling held, exactly as the weak-volume approach suggested it would.
The rejection confirms two things at once: that the stacked OB band is live supply, and that the downtrend remains intact. The LH that prints at the rejection is the structural marker — a lower high that continues the bearish sequence and keeps the directional bias pointing down. For a trader who recognized the weak-volume approach as a continuation signal, this rejection is the payoff: the short taken into the stacked supply is now working as the markdown resumes.
The mechanic behind the rejection is the concentrated supply in the band. Each OB layer represents sellers who delivered at this price and are willing to defend it. When a weak rally arrives, it doesn’t bring enough buying to absorb that supply, so the sellers reassert control and drive price back down. The stack is what makes the rejection so reliable — a single OB might be overwhelmed, but a band of them reinforcing each other is a far harder ceiling to break.
5. Fresh LL — trend continues down
From the rejection, price drives to a fresh lower low. The markdown resumes with conviction, taking out the prior low and extending the downtrend. The LL confirms the structural continuation — the bias was down, the rally into supply failed, and the trend has resumed in its established direction.
This fresh LL is the structural proof that the read was correct. The downtrend bias held, the stacked supply rejected the rally, and price made a new low. Each component reinforced the others: the bias said sell rallies, the weak volume said this rally would fail, the stacked OB said where it would fail, and the rejection plus fresh LL confirmed it all.
For a trader positioned short from the rejection, this is where the trade pays. The entry was at the stacked supply on the weak-volume rally; the target is the continuation to new lows; the stop sits just above the OB band, where a decisive close would have invalidated the bearish thesis. The fresh LL is the trade working — and it sets up the question the second half of the chart will answer: will the next rally into the stacked supply behave the same way?
Phases 6–10 — The second rejection and the capitulation low
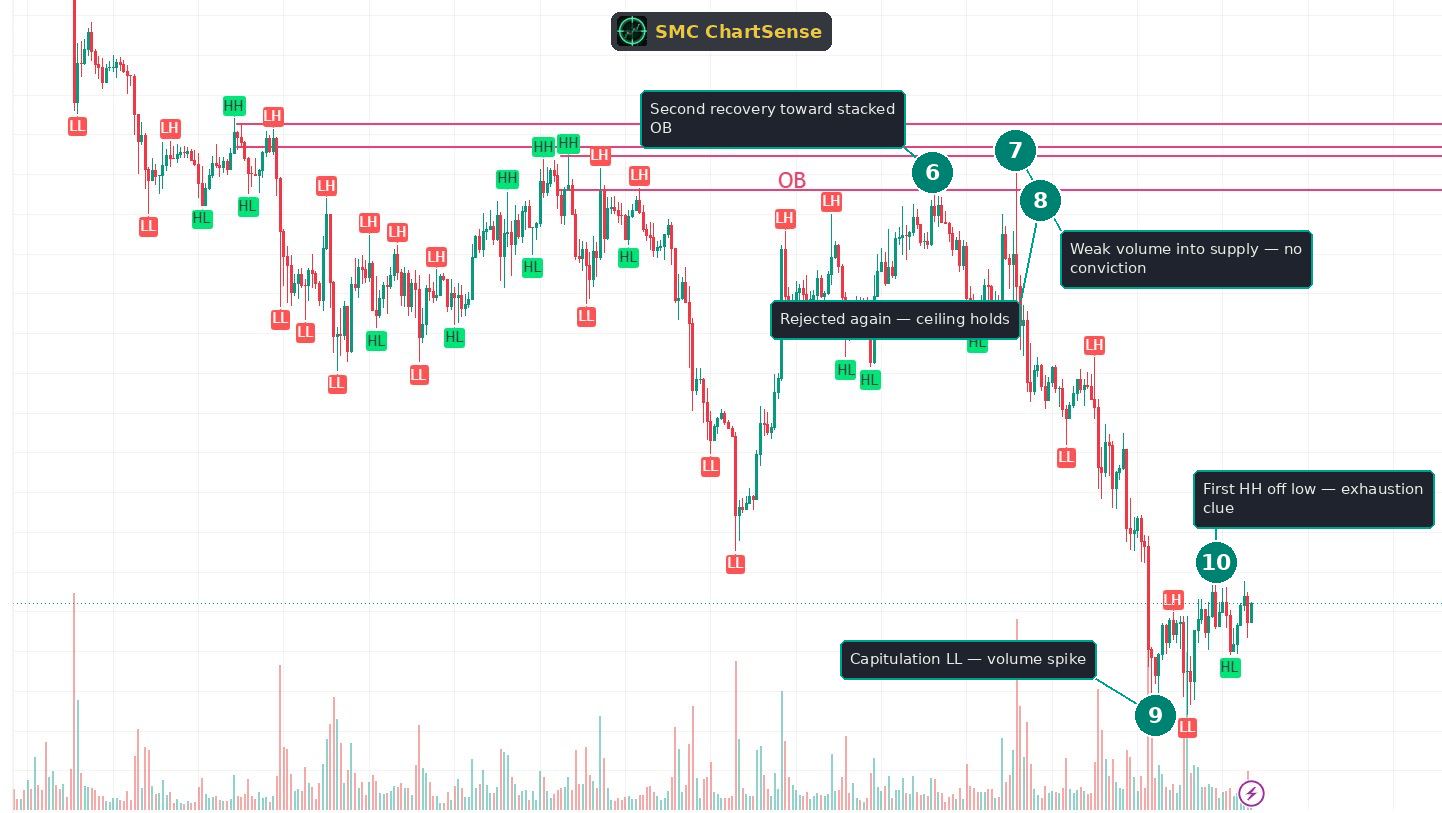
6. Second recovery toward stacked OB
After the fresh low, price mounts a second, larger recovery and climbs back toward the same stacked OB band. This is the second test of the reinforced ceiling, and it’s a more substantial rally than the first — it travels further and looks, on price alone, like it might have the momentum to break through.
This is where the discipline of the read is tested. The rally is large enough to make a trader wonder whether the downtrend is ending. The instinct is to start questioning the bearish bias — maybe this time the recovery is real, maybe the stacked supply finally gets broken. The way to resolve that doubt is not to guess from price alone but to read the volume on the approach, exactly as in the first test. The destination is the same stacked OB band; the question is whether this approach carries any more conviction than the last one.
7. Weak volume into supply — no conviction
The volume answers the question. Despite the larger price move, the rally into the stacked supply again arrives on weak volume — no expansion, no conviction. The move looks bigger on price, but the volume reveals it’s the same kind of rally as before: short-covering and dip-buying, not institutional accumulation committing to a breakout.
This is the critical read of the entire chart. A larger rally on weak volume is still a weak rally. Price alone would have you believe the second recovery is more serious than the first, but the volume tells you it’s the same hollow move — bigger in size, no stronger in conviction. The buyers approaching the stacked supply still don’t have the firepower to break the reinforced ceiling.
The contrast with what a real reversal looks like is what makes this readable. If this rally were the one to break the downtrend, the approach into the stacked OB would show volume expansion — a visible surge of buying as institutions commit to overwhelming the supply. Instead, the volume stays muted. The reinforced ceiling is meeting weak demand for the second time, which sets up a second rejection.
8. Rejected again — ceiling holds
The stacked supply rejects price for the second time. The rally stalls at the band, prints another lower high, and rolls back into the downtrend. The reinforced ceiling has now held twice, under two separate recovery attempts, confirming its strength.
The second rejection is more significant than the first because it demonstrates durability. A ceiling that holds once might be coincidence; a ceiling that holds twice, against a larger second attempt, is a level institutions are clearly defending. The stacked OB band has now proven itself as the dominant supply on the chart — every rally that reaches it fails, and the failures keep the downtrend intact.
For a trader, the second rejection is a second short opportunity at the same level, with the same logic: weak-volume rally into reinforced supply, rejected, trend resumes. The repetition is the edge. Once a stacked OB band has rejected one weak-volume rally, the next weak-volume rally into the same band is an even higher-conviction setup, because the level has demonstrated it will defend. The market is offering the same trade twice, and the second offering comes with confirmation the first one lacked.
9. Capitulation LL — volume spike
From the second rejection, the markdown accelerates and drives into a capitulation low at the bottom-right of the chart. And here, finally, the volume changes character: the capitulation low prints on a volume spike — one of the largest bars on the chart.
This volume spike is a different signal from everything that came before. Throughout the downtrend, the meaningful volume reading was the weakness of the rallies into supply. Now, at the capitulation low, volume expands sharply — and that expansion at a low has a specific meaning. A heavy-volume low in a sustained downtrend is often the climax of the selling: panicked sellers capitulating in size, their supply being absorbed by buyers stepping in at the lows. It’s the same absorption signature that marks the end of a markdown, and it’s the first hint that the downtrend may be exhausting.
The diagnostic is the same one that runs through all volume reading: a spike quantifies a large transfer of inventory, and the direction of that transfer is revealed by what price does next. If price continues lower after the spike, the heavy volume was continuation. If price reverses, the heavy volume was capitulation and absorption. The next phase is what begins to tell which one this is.
10. First HH off the low — exhaustion clue
After the capitulation low, price prints its first higher high — the first break of the downtrend’s structure in the entire chart. Every prior swing high was a lower high; this is the first HH off the low. It’s the earliest structural clue that the trend may be exhausting.
This single HH is not yet a confirmed reversal. One higher high in a sustained downtrend is a clue, not a confirmation — the trend has been down for the entire chart, and one counter-structural move doesn’t undo that. But combined with the capitulation volume spike at the low, it’s the first evidence that the character of the market may be shifting. The heavy-volume low said a large transfer of inventory occurred; the higher high says buyers are, for the first time, able to push price above a prior swing.
For a trader, this is the moment to stop pressing shorts and start watching for a potential character shift. The downtrend bias that governed the entire chart is now, for the first time, under question — not invalidated, but questioned. A confirmed reversal would require more: a clean break of the most recent LH, a CHoCH, a return to the structure to confirm support. But the capitulation spike plus the first HH is the early-warning combination that tells a disciplined trader the easy part of the downtrend is over. The stacked supply above still caps the upside, but the relentless selling that defined the chart has, for now, met its first real buying.
What this scenario teaches that most SMC content misses
Three observations from this chart that get less attention than they deserve in standard SMC education:
Stacked order blocks are one reinforced ceiling, not a series of separate levels. Most SMC content analyzes each order block in isolation, drawing every zone as an independent level to trade against. That fragments the picture and produces low-conviction reads, because a single OB can be overwhelmed. The more useful approach is to recognize when multiple OBs cluster at a similar price band and to treat the cluster as one reinforced supply region. Each layer represents a separate occasion on which sellers delivered at that price, so a stack concentrates far more institutional supply than any single zone. A rally into a stacked OB band is meeting a reinforced ceiling, which is why the rejections in this chart were so reliable. Reading the stack as one level — and weighting it accordingly — is what separates a high-conviction continuation read from a scatter of independent zones.
A weak-volume rally into supply is a continuation signal, not a reversal. The instinct when price rallies in a downtrend is to wonder whether the trend is ending. The volume on the approach answers the question definitively. A rally that’s going to break through supply and reverse the trend arrives with volume expansion — institutions committing in size to overwhelm the sellers. A rally that’s going to fail and continue the downtrend arrives on weak volume — short-covering and dip-buying with no real conviction behind it. In this chart, both rallies into the stacked supply came on weak volume, and both failed. The size of the rally is a distraction; the second rally was larger than the first but no stronger in conviction, and the volume revealed it. Reading the quality of the rally rather than its size is the diagnostic that keeps a trader on the right side of a trend.
The volume signal that matters changes depending on where you are in the trend. For most of this chart, the meaningful volume reading was the weakness of the rallies into supply — low volume confirming continuation. But at the capitulation low, the meaningful reading flipped: a volume spike at the bottom signaled possible absorption and exhaustion. The same tool — volume — was used to read continuation in the middle of the trend and potential reversal at the end, and the interpretation depended entirely on context. Weak volume on a rally into supply means continuation. Heavy volume on a capitulation low means possible exhaustion. A trader who reads volume mechanically — “high volume bullish, low volume bearish” — learns nothing. A trader who reads volume against structure and trend context extracts a different, correct signal at each stage.
The reader’s takeaway
The mental model: in a downtrend, stacked supply zones are a reinforced ceiling, and the quality of the rally into them is the entire trade. A weak-volume rally into layered OBs is the market offering you a short. A strong-volume close through them would be the market warning the trend is ending. The volume on the approach, read against the stacked zone, tells you which one you’re looking at.
The sequence for trading a bearish trend against stacked supply has three parts. First, establish the downtrend bias from the LL/LH structure, and recognize that rallies are retracements to be sold until the structure proves otherwise. Second, identify the stacked OB band as one reinforced ceiling, not a set of separate levels — the more layers, the stronger the supply. Third, read the volume on each rally into the band: weak volume confirms the rally will fail and the trend will continue, making the approach into the stacked supply a short; volume expansion would warn that this rally is different and that the ceiling may break.
The volume reading is the spine of the analysis, and its meaning shifts with context. In the body of the trend, weak volume on rallies into supply is the continuation tell — it says the buying lacks conviction and the reinforced ceiling will hold. At the end of the trend, a volume spike on a capitulation low is the exhaustion tell — it says a large transfer of inventory has occurred and the selling may be climaxing. The same indicator, read against structure and trend position, gives the correct and opposite signal at each stage.
In this chart, every part of the sequence was present. The downtrend established a clear bearish bias. A stacked OB band formed near the highs as reinforced supply. Two separate rallies climbed into that band on weak volume, and both were rejected, each followed by a fresh low. The markdown finally drove into a capitulation low on a volume spike, and the first higher high off that low gave the earliest clue the trend might be exhausting. A trader who read the stacked supply as one ceiling, sold the weak-volume rallies into it, and recognized the capitulation spike as a shift in character was on the right side of the entire move.
The trap to avoid is being drawn into the second rally by its size. The second recovery was larger than the first and looked, on price alone, like it might be the reversal. But the volume revealed it was the same hollow move — bigger, not stronger. Reading the quality of the rally rather than its magnitude is what kept a disciplined trader short into the second rejection rather than buying the apparent breakout that never had the conviction to break.
The skill being trained here is reading trend continuation through the relationship between supply and rally quality. A downtrend doesn’t fall in a straight line — it falls in steps, with rallies between the legs. The stacked supply tells you where those rallies will fail, and the volume tells you whether each rally has the conviction to be the one that doesn’t. Until a rally arrives with volume expansion and breaks the reinforced ceiling, the downtrend continues, and every weak-volume approach into the stacked OBs is another opportunity to trade with the trend.
Read enough bearish trends against stacked supply at this depth, and the pattern becomes obvious in real time. The signs are always the same: a clean LL/LH downtrend, a band of layered OBs forming one reinforced ceiling, rallies into that band that arrive on weak volume and get rejected, fresh lows confirming continuation, and eventually a capitulation low on a volume spike that hints at exhaustion. Each component is independently readable. The trade is what the components point toward, taken together as the life cycle of a downtrend capped by reinforced supply.
Would a setup like this have held up across years of data?
Reading one chart is insight. Knowing whether a pattern has a statistical edge across hundreds of historical instances is something else. SMC ChartSense lets you configure SMC strategy parameters — order blocks, FVG, market structure, risk-reward — and backtest them against years of Binance perpetuals data. No coding required.
Try the SMC Backtester →Educational research tool. Not investment advice. Past performance does not guarantee future results.
DISCLAIMER: This article is for educational purposes only. It explains concepts from technical analysis literature and reads a historical chart for teaching purposes. It does not constitute financial advice, trading advice, or investment recommendations. SMC ChartSense is strictly an educational simulator designed for pattern recognition practice. We do not provide brokerage services, market recommendations, or execution platforms. We are not registered as a Research Analyst.