
Multi-Cycle Trend Continuation: How a Deep Sweep at Original Demand Fuels the Trend’s Final Leg
A clean tape read of a bullish trend that plays out across multiple peaks and pullbacks before producing its strongest leg. An early BOS sets the directional bias and a demand zone forms at the start of the cycle. After two impulse legs and a long ranging descent, price returns to the original demand zone with a deep wick — a single decisive test that triggers the institutional bid and fuels the trend’s final leg to new highs. The teaching most SMC content avoids: trends aren’t straight lines, and the deepest pullback to the earliest demand is often the cleanest entry, not a structural break to fade.
SMC ChartSense Team · 15 min read
What this article reads: A complete multi-cycle trend from BOS to cycle peak. The chart opens with an early bullish BOS that establishes a demand zone (the green band) at the start of the cycle. Two impulse legs follow — first to a major HH peak, then to a second HH peak — separated by a moderate pullback that stays above demand. After the second peak, a long and complex descent develops, eventually producing a deep long-wick LL that pierces the original demand zone. The recovery from that test is sharp and institutional, leading to the trend’s final leg and the highest HH of the entire cycle on the right edge. The teaching focus is how to read trends as multi-cycle programs rather than straight lines, why the deepest pullback to original demand is the institutional re-entry signal rather than a structural break to fade, and how the macro bias set by the first BOS is the only reliable anchor across the entire complex middle section.
Phases 1–5 — The BOS, the demand zone, and two impulse legs

1. Bullish BOS — directional bias set
The chart opens with a bullish break of structure. The blue BOS marker shows price taking out a prior swing high, confirming a shift from whatever the prior structure was to a bullish bias. (BOS = Break of Structure: a body close beyond a relevant swing point that confirms trend continuation or reversal. A bullish BOS breaks above a prior LH or swing high; a bearish BOS breaks below a prior HL or swing low.)
What this BOS does for the rest of the chart is anchor the macro bias. Once a bullish BOS prints, the bias for the entire cycle that follows is up. This anchoring is critical because the chart we’re about to read is complex — multiple peaks, a long ranging descent, and a deep pullback that looks bearish in isolation. Without the macro bias as a reference point, every internal pattern in the middle looks like a complete setup. With the macro bias as a reference, the internal patterns become noise — context for the real resolution that will happen when the trend’s final leg fires.
This is also the moment that establishes the demand zone. The price band immediately below the BOS, where price last consolidated before breaking out, becomes the trend’s structural floor. That zone is where institutional buyers placed orders that fueled the BOS, and it remains a reference point for as long as the trend lasts.
2. Demand zone forms — original HL
The green band visible across the chart marks the demand zone established at the BOS. The HL inside this zone is the original HL of the bullish cycle — the price band where institutional buyers entered to drive the original break. (Demand zone = the price band where institutional buy orders are concentrated, identified by a consolidation that immediately precedes a strong upward move. Mirror of a supply zone.)
The teaching implication: as long as this zone hasn’t been mitigated by a deep return that fills the orders, the bullish bias remains structurally intact. Pullbacks that don’t reach this zone are normal trend mechanics. A pullback that reaches the zone is a re-entry opportunity. A pullback that breaks through the zone on a closing basis would invalidate the bias — but a wick-only test of the zone, followed by a strong reversal, is the institutional re-engagement.
This zone is going to sit at the bottom of the chart through the entire cycle. It won’t be tested for a long time. When it eventually is tested — late in the chart — the test will be the most important event of the entire trend, even though it looks like nothing more than a deep wick at the time.
3. First impulse — major HH peak
The first impulse leg after the BOS is steep and decisive. Price rallies from the demand zone to the first major HH at the top of the upper-left portion of the chart. The structure on the way up is clean — HHs and HLs in sequence, no significant intermediate consolidation, candles printing solid bullish bodies that close near their highs.
This is what a real impulse leg looks like. The macro bias from the BOS is being expressed directly through price action — institutional buyers are still active, retail traders are starting to recognize the trend and pile in, and the path of least resistance is clearly up. The HH that prints at the top of this leg is the cycle’s first major peak.
What separates a real impulse leg from a fake one is the absence of meaningful pullbacks during the move. If the rally had stalled at intermediate levels, printed LHs, or started showing smaller-bodied candles with longer wicks, that would be evidence that the impulse was already exhausting. None of that happens here. The leg is one-directional, which is the structural signature of strong institutional commitment behind the move.
4. First pullback — stays above demand
After the first peak, price pulls back. The pullback produces an LL that’s well above the demand zone — visible in the lower-left portion of the chart. The structure during the pullback is clean: LH, then LL, then the bottom of the move, then a recovery that starts building HLs again.
What matters here is the depth of the pullback. It stops well above the original demand zone, which means the demand hasn’t been tested yet. The bullish bias remains intact because the structural floor of the cycle remains untouched. Pullbacks that don’t reach demand are normal trend mechanics — they’re where institutional buyers add to positions at slightly better prices without needing to defend the original floor.
For traders reading this in real time, the takeaway is straightforward. The first pullback is a re-entry zone for the trend, not a reversal signal. Long positions can be added with stops below the pullback’s low, which becomes a new HL in the bullish structure. The original demand zone remains as the ultimate invalidation level — only a close below that zone would change the bias.
The interesting question, which the chart will eventually answer, is whether the trend’s next pullback will be similarly contained or whether it will eventually reach the original demand. The structure to this point suggests a healthy trend; the next several phases will test whether that’s actually the case.
5. Second impulse — second HH peak
The recovery from the first pullback produces a second impulse leg, this one ending at a second HH peak in the middle of the chart. This second peak is slightly lower than the first peak in absolute terms but still represents a structural HH within the bullish cycle. The macro trend is still intact.
The fact that the second peak doesn’t extend above the first peak is worth noting. In a perfectly healthy multi-cycle trend, each subsequent peak should make a new high. When a second peak fails to make a new high — as happens here — it’s an early signal that the immediate bullish momentum is starting to weaken. This doesn’t invalidate the macro bias, but it does suggest the trend is entering a more complex phase.
This is also the moment where traders who read trend structure mechanically can get into trouble. The lower-second-peak interpretation can be read as “the trend is failing” — and that interpretation will produce short entries that the rest of the chart will punish. The macro bias from the original BOS is still bullish; the demand zone hasn’t been tested yet; the cycle isn’t complete until either a new HH forms above the first peak or the demand zone is broken on a close. A lower-second-peak is a signal to expect deeper pullbacks ahead, not a signal to flip bias.
Phases 6–10 — The descent, the sweep, and the trend’s final leg
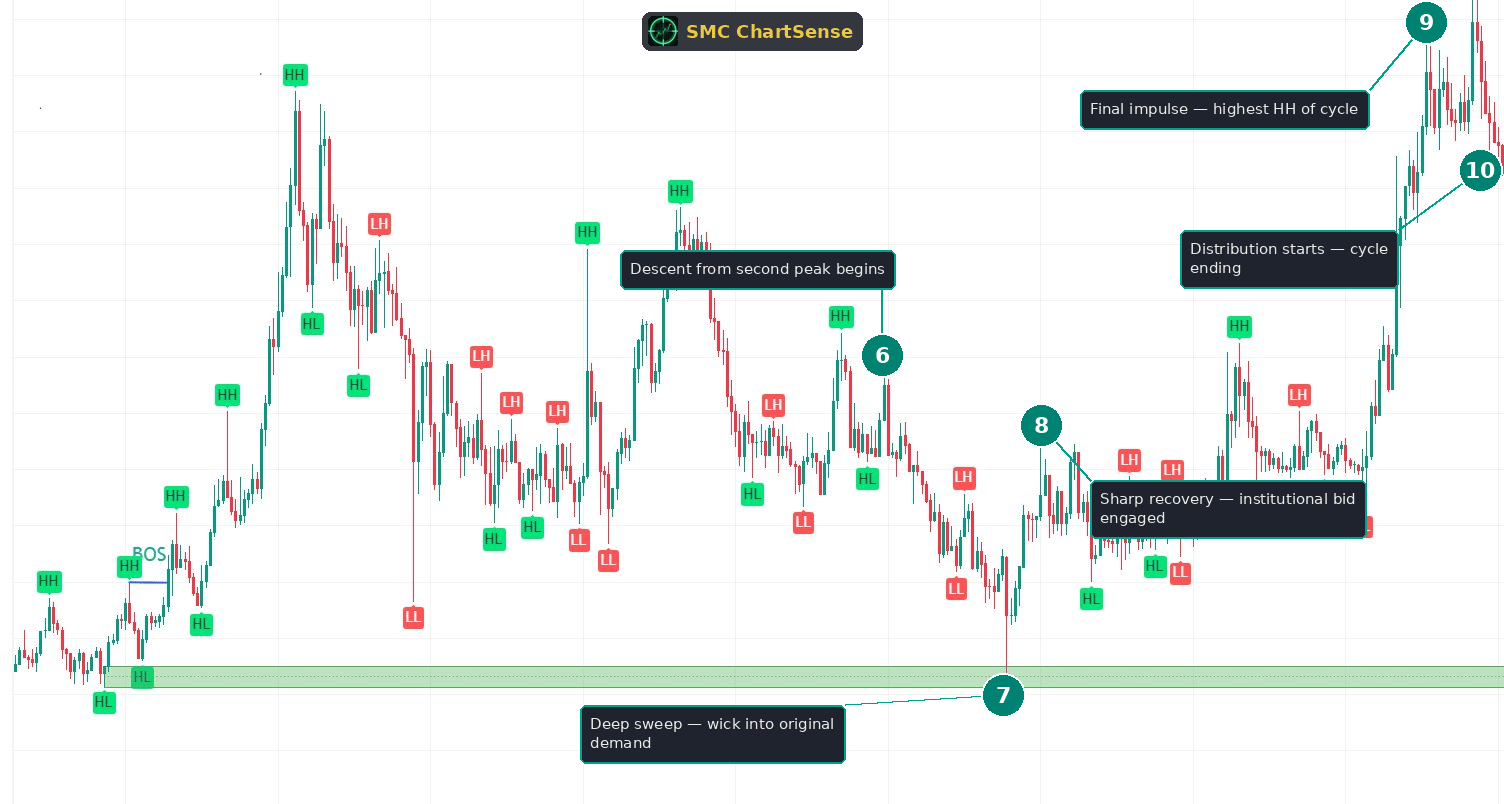
6. Descent from second peak begins
After the second peak, the chart enters a long and complex descent. This isn’t a clean impulse leg down — it’s a series of LHs and LLs interspersed with smaller recoveries, with the overall structure trending lower. The descent occupies a meaningful portion of the chart’s horizontal span and takes price well below the second peak, but still keeps it above the original demand zone.
This phase is where the macro bias gets tested most aggressively. Traders without the BOS anchor see lower highs forming, lower lows printing, and structural deterioration. They flip bias to bearish based on the immediate structure. But the original BOS still hasn’t been invalidated — no close below the original demand zone has occurred — so the macro bias remains bullish, even as the immediate structure looks bearish.
This is the discipline being tested. Reading multi-cycle trends correctly requires holding the macro bias through phases that look contradictory in isolation. The chart will eventually reward this discipline by producing the trend’s strongest leg, but only after a deep test that looks structurally bearish in real time.
The intermediate structure during this descent isn’t tradeable as a trend reversal. It’s tradeable only as a continuation pullback toward the eventual demand test. Shorts entered here against the macro bias will need to be covered before the demand zone test produces the institutional reversal.
7. Deep sweep — wick into original demand
The descent eventually produces the deepest LL of the chart. The candle that creates this LL has a long lower wick that pushes into the original demand zone — the first test of that zone since the trend began. This is the structural moment the entire chart has been building toward.
Several things happen mechanically at this candle. First, the LL sweeps the sell-stops sitting below the prior LLs from the descent — those stops execute as market sell orders, providing fresh supply for institutions that are simultaneously bidding into the demand zone. Second, the long wick is the visible signature of the institutional bid being filled — supply gets exhausted at the bottom of the wick, and the candle closes well above its low. Third, the close itself stays inside or just above the demand zone, which means the zone has not been mitigated on a closing basis. (Sweep = price extending beyond a visible support or resistance level just enough to trigger stop orders sitting beyond that level, then reversing. The sweep is what allows institutions to enter positions at better prices than the visible level offers.)
The structural read on this candle: it looks like a bearish breakdown in real time, but it’s actually the trend’s deepest pullback being absorbed by the institutional bid that started the cycle. The sweep mechanic makes the move look terminal — price has just broken to a new low — but the wick rejection and the close back inside the demand zone tell the real story.
Traders reading this candle without the macro bias as context will see it as confirmation of the bearish reversal that the descent suggested. Traders with the macro bias as context will recognize it as the deep test of original demand that the chart has been building toward — and the cleanest re-entry the trend has offered.
8. Sharp recovery — institutional bid engaged
The candles that follow the deep wick are decisively bullish. Wide bullish bodies, expanding to the upside, with the move developing into a clear rally. The recovery isn’t gradual — it’s impulsive, which is the visible signature of institutional buying that has just been re-engaged at the original demand zone.
The mechanic at work: the institutional buyers who started the cycle at the demand zone are still active. The deep pullback gave them the opportunity to add to positions at the original entry level, after months of trend development that took price well above their initial entry. The orders filled at the wick are the same kind of orders that fueled the original BOS — and they’re now fueling the trend’s final leg.
The traders who entered short during the descent are the immediate victims of this reversal. Their stops sit at the prior LH or the swing high preceding the demand test, and the recovery candles trigger them in sequence. Their forced buy-to-cover orders accelerate the rally, which is why post-demand-sweep recoveries are usually impulsive rather than gradual. The cascade effect of trapped shorts is built into the move’s velocity — the deeper the sweep was, the more shorts get trapped, the more violent the reversal becomes.
For traders who held the macro bias through the descent, this is the moment to scale into long positions if they weren’t already entered. The signal is unambiguous: the demand zone held, the recovery is impulsive, and the trend’s final leg has begun.
9. Final impulse — highest HH of the cycle
The recovery from the demand sweep develops into the trend’s strongest leg. Price extends well above the prior swing highs, takes out the first major HH peak from earlier in the chart, and continues higher to print the highest HH of the entire cycle near the top-right edge of the chart. This is the structural confirmation that the cycle has resumed and resolved bullishly.
This new HH is structurally significant in a way the prior peaks weren’t. The first peak was the cycle’s first major high. The second peak was a lower high that suggested the trend was weakening. The third peak — this one — is the cycle’s true peak, the price level the entire trend was building toward all along. It exceeds both prior peaks and represents the full expression of the original BOS’s directional thesis.
The structural insight: multi-cycle trends often save their strongest leg for last. The intermediate peaks are tests of the trend’s structure — failed attempts at extension that are followed by deeper pullbacks. The final peak comes after the deepest pullback has been absorbed, when the institutional buyers have completed their re-entry program and have nothing left to do but let the trend extend.
For traders positioned long since the demand sweep, this leg is where the largest gains of the cycle accumulate. The leg from the demand wick to this final peak is typically the largest single move in the entire chart, by a significant margin, because it carries the combined fuel of institutional re-entry and trapped-short capitulation.
10. Distribution starts — cycle ending
After the final peak, price prints a sharp drop visible at the right edge of the chart. The drop has the visible signature of distribution starting — wide bearish bodies, no immediate recovery, lower highs forming quickly. This is the early evidence that the cycle is completing and that the next phase will be the trend’s distribution into the highs.
The distribution at this stage isn’t yet a structural reversal. The macro bias from the original BOS is still bullish, and the cycle’s structural floor — the original demand zone — is still far below current price. But the impulsive bearish move at the right edge is a warning sign that the trend’s directional momentum is exhausting. The same institutional buyers who fueled the entire cycle are now starting to unload at the cycle’s peak, which is what distribution looks like in real time.
For traders positioned long since the demand sweep, this is the moment to take profits or tighten stops aggressively. The trade that worked through the entire cycle has now reached its target — the cycle’s true peak — and the structural signs are starting to favor a shift toward a different market phase.
The teaching: distribution doesn’t announce itself with a BOS or a CHoCH. It begins with a single impulsive bearish move at the cycle’s high — exactly the kind of move visible at the right edge here. Recognizing that signal allows traders to exit at favorable prices rather than waiting for the structural confirmation that comes well after the highs are already in.
What this scenario teaches that most SMC content misses
Three observations from this chart that don’t get enough explicit attention in standard SMC education:
Trends are not single impulse legs. They’re multi-cycle programs with peaks, pullbacks, and complex internal structure. Most introductory SMC content frames trends as clean directional moves with occasional pullbacks. That framing works for short-lived trends in narrow timeframes but breaks down on charts like this one, where the trend extends across multiple peaks and includes phases that look structurally bearish in isolation. Reading these trends correctly requires recognizing that the entire cycle is one program — set up by the original BOS, fueled by the demand zone, tested at intermediate peaks, and resolved by the final leg after the deepest pullback. The intermediate structure is fuel, not signal. The pullbacks are re-entry opportunities, not reversal signals. The macro bias is preserved throughout, even when the immediate structure looks contradictory.
The deepest pullback to the earliest demand is usually the cleanest entry, not a structural break to fade. Beginners are taught to fade deep pullbacks because deep pullbacks “look like reversals.” This intuition is correct in some contexts — for example, when the pullback closes decisively below the original demand zone and holds there, that’s a real structural break. But when the pullback only wicks into the demand zone and closes back inside or above it, the deep move is the institutional re-entry signal. The chart in front of us is a clean example: the deepest LL of the cycle wicks into the original demand zone, closes above it, and produces the trend’s strongest leg. Trading this as a reversal would have been a catastrophic misread. Trading it as the institutional re-engagement was the trade of the entire cycle.
Distribution at cycle peaks doesn’t announce itself with a BOS. It starts with a single impulsive bearish move at the high. The structural framework for identifying reversals — wait for the BOS or CHoCH in the new direction — works well for spotting reversals after they’ve been confirmed. But by the time a bearish BOS prints after a major cycle peak, the largest profits of the move have already been given back. Recognizing distribution earlier requires reading the character of the move at the cycle’s high, not waiting for the structural confirmation. An impulsive bearish move from the cycle peak — wide-bodied, closing near its low, with no immediate recovery — is the early signal that distribution has begun. The structural confirmation will come later, but the move started before the confirmation.
The reader’s takeaway
The mental model: trends are not straight lines, and the most important moments in a multi-cycle trend are the ones that look most contradictory in isolation. The deepest pullback to original demand is the cleanest re-entry. The lower-second-peak is a signal to expect deeper pullbacks, not to flip bias. The impulsive move at the cycle’s peak is the start of distribution, not a temporary correction.
When you’re reading a chart with a clear directional BOS followed by multiple peaks and pullbacks, the question to ask is not “is the trend reversing?” at every structural break. The question is “where is the original demand zone, and has it been tested yet?” The trend remains intact until the original demand is broken on a close — and the deepest pullback toward that demand is often the cleanest entry for the trend’s strongest leg.
When the demand test does come, the character of the test is the diagnostic. A wick rejection that closes back inside or above the demand zone is the institutional re-entry. A decisive close below the zone that holds there is the structural reversal. The closing print, not the wick depth, is what separates one from the other.
In this chart, the macro bias was bullish from the start because of the original BOS. The structure that followed was complex — two peaks, a long descent, a deep wick into demand — but the bias never needed to flip because the demand zone was never broken on a closing basis. The deep wick at the demand zone was the institutional re-entry, and the final leg to the highest HH of the cycle was the trend’s true peak.
Reading this chart correctly required holding the macro bias through the descent, treating the intermediate structure as continuation rather than reversal, and recognizing the deep wick at demand as the entry signal rather than the breakdown signal. The trader who did this was positioned for the entire final leg. The trader who flipped bias during the descent or shorted the deep wick was caught against the trend’s strongest move.
The skill being trained here is bias preservation across complex structure. The chart spent dozens of candles producing patterns that contradicted the original BOS. The institutional program never wavered, but recognizing it required reading the chart at the timeframe of the program — the cycle that started at the BOS and resolved at the final HH — rather than at the timeframe of the individual setups inside the descent.
Read enough multi-cycle trends at this depth, and the pattern becomes obvious in real time. The signs are always the same: a directional BOS that anchors the macro bias, an early demand zone that sits as the structural floor, intermediate peaks that test the trend’s structure, a long pullback that looks bearish in isolation, a deep wick into the original demand that resolves the descent, and a final impulse leg that produces the cycle’s true peak. Each component is independently readable. The trade is what the components point toward, taken together as a single institutional program.
Would a setup like this have held up across years of data?
Reading one chart is insight. Knowing whether a pattern has a statistical edge across hundreds of historical instances is something else. SMC ChartSense lets you configure SMC strategy parameters — order blocks, FVG, market structure, risk-reward — and backtest them against years of Binance perpetuals data. No coding required.
Try the SMC Backtester →Educational research tool. Not investment advice. Past performance does not guarantee future results.
DISCLAIMER: This article is for educational purposes only. It explains concepts from technical analysis literature and reads a historical chart for teaching purposes. It does not constitute financial advice, trading advice, or investment recommendations. SMC ChartSense is strictly an educational simulator designed for pattern recognition practice. We do not provide brokerage services, market recommendations, or execution platforms. We are not registered as a Research Analyst.